Groundwater, Engineering, Environmental & Mining
![]() Hasbrouck
Geophysics, Inc.
Hasbrouck
Geophysics, Inc.
![]()
Groundwater, Engineering, Environmental &
Mining
Rippability (Refraction Seismic)
A refraction seismic survey was conducted in the southwest United States to measure compressional-wave velocities as an aid in the evaluation of the rippability of the subsurface. Data were acquired along five lines, however only one representative data set will be shown in this example. The 24-channel refraction seismic data were acquired with a signal-enhancement seismograph, geophone intervals of 10 feet, and a 16-pound sledgehammer source with impacts made at various distances offset and along the seismic profile. Because of site logistics limitations, a total spread length (including source offset) of only 240 feet was possible. The geophones were located on a nominally straight line and distances were measured with a tape. Relative elevations were surveyed with a level and stadia rod. The seismic data were stacked, nominally, eight times at each source point to increase the signal-to-noise ratio. Stacking, or signal enhancement, involved repeated source impacts at the same point into the same set of geophones. For each source point, the stacked data were recorded into the same seismic data file, or record, and, theoretically, the seismic signal arrived at the same time from each refracting layer and thus was enhanced, while noise was random and tended to be reduced or canceled. Overall, the quality of the seismic data was excellent and easily identifiable first breaks (first arrival of seismic energy) were present.
The refraction seismic data were processed and interpreted using the SIP (version 4-1) set of computer programs from Rimrock Geophysics Inc. of Lakewood, Colorado. The general processing and interpretation flow consisted of choosing, or picking, the first breaks, creation of data files for input into the interpretation program, and interpretation of the data using modeling and iterative ray-tracing techniques. The interpretation program uses the delay-time method to obtain a first-approximation depth model, which is then trimmed up by a series of ray-tracing and model adjustment iterations to minimize any discrepancies between the picked arrival times and corresponding times traced through a 2.5-dimensional model. Arrival times at two geophones, separated by some variable XY-distance, are used in refractor velocity analyses and time-depth calculations. Using the principles of migration and iterative ray-tracing, forward and reverse seismic rays emerge from essentially the same point on the refractor, thus requiring the refractor to be plane over only a small distance. The ray-tracing procedure tests and corrects the estimated migrated position of points representing the locations of ray entry and emergence from the refracting horizon and takes into account the dip of the refracting horizon at those emergence points, therefore enabling accurate representation of steeply dipping horizons.
Several routines within the SIP computer program set are used for selection of the proper velocities. For the direct arrivals through the first layer, the velocity is computed by dividing the distances from each source point to each geophone by the corresponding arrival times. These individual velocities are averaged for each source point, and a weighted average is computed. For layers beneath the first layer, velocities are computed by two methods: 1) Regression, in which a straight line is fit by least squares to the arrival times representing the velocity layer and average velocities are computed by taking the reciprocals of the weighted average of the slopes of the regression lines, and 2) the Hobson-Overton method wherein velocities are computed if there are reciprocal arrival from two opposing source points at two or more geophones. Final velocities used in the inversion process are computed by taking an average of the two methods or assigning override values under certain circumstances.
Figure 1 is an example relative elevation versus distance refraction seismic depth model with annotated average velocities for each layer. The estimated total depth of investigation was computed by simply subtracting 60 feet from the relative surface elevation. In refraction surveys, depth of investigation is related both to the length of the surface spread of geophones and source points, and the expected subsurface velocities. Since basement in the survey area probably consists of relatively fast velocity material (assumed greater than 8000 feet per second), the first geophone to "see" a refraction from that layer would be at a distance of 3 to 4 times the expected depth (i.e., if 60 feet depth to basement is assumed then that geophone would be at 180 to 240 feet along the spread). Since a refraction was not apparent within the data from a third layer along any of the lines, only an estimate of depth of investigation can be made. For the figure, a conservative estimate of 60 feet was chosen (total spread length of 240 feet divided by 4), but the depth of investigation could be deeper (i.e., 80 feet or 240 divided by 3). However, without a refraction from the third layer, the depth is only an estimate.
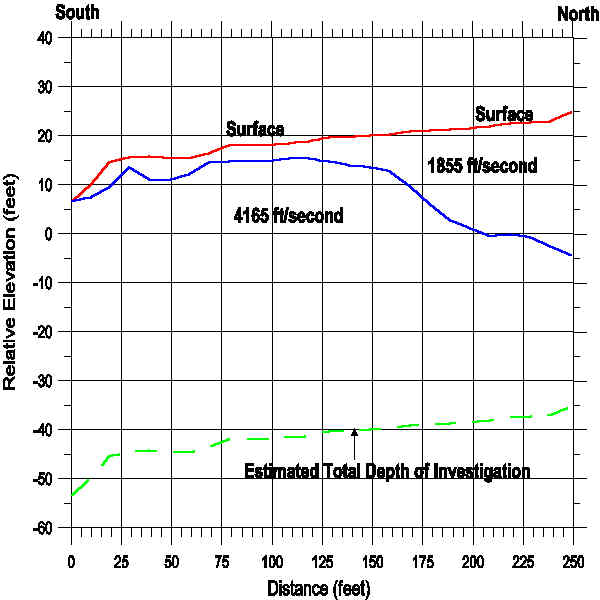
Figure 1: Refraction Seismic Depth Model
As discussed above, refraction seismic depth models with only two layers were computed for each line since no refraction from a third layer was present within any of the data. The first layer velocity in figure 1 of 1855 feet per second is consistent with that expected from unconsolidated sediments, while the second layer velocity of 4165 feet per second is indicative of the Gila Conglomerate (which is present within the survey area). Using these geophysically estimated velocities for the subsurface in conjunction with tables prepared by the Caterpillar Tractor Company, it should be possible to rip to the estimated depth of investigation with a D9, D8 or D7 ripper. However, marginal rippability occurs for conglomerates at about 4500 feet per second for a D7 ripper, so it would probably be more cost effective to use a D8 or D9 since the velocity of the second layer approaches the limits of the D7 ripper.
![]()
Hasbrouck Geophysics, Inc.
12 Woodside Drive
Prescott, Arizona 86305
USA
928-778-6320 (Telephone and Fax)
928-925-4424 (Mobile)
jim@hasgeo.com (E-mail)
![]()
![]()
Last Modified: 10 November 2004 @ 15:40