Groundwater, Engineering, Environmental & Mining
![]() Hasbrouck
Geophysics, Inc.
Hasbrouck
Geophysics, Inc.
![]()
Groundwater, Engineering, Environmental &
Mining
Excavation/Rippability (Refraction Seismic)
A refraction seismic survey was conducted in the south-central United States to map the extent, depth and velocity of a caliche layer and then relate the resultant seismic velocity values to rippability charts prepared by Caterpillar Inc. to determine where it may be possible to rip (and with which size tractor), if pre-blasting might be necessary or if the material was non-rippable. The caliche layer had presented problems in the past to contractors attempting to rip the area therefore information about its presence and characteristics was considered beneficial for efficient excavation in the area.
Refraction seismic data were acquired along three lines, however only one representative data set will be shown in this example. The 48-channel seismic data were acquired with a signal-enhancement seismograph, geophone intervals of 5 feet, and an 8-pound sledgehammer source with impacts made at various distances offset and along the seismic profile. The geophones were located on a nominally straight line and distances were initially measured in the field with a tape. Subsequently, each source and geophone location was surveyed with sub-cm GPS and tied to the local grid. The seismic data were nominally stacked eight times at each source point to increase the signal-to-noise ratio. Stacking, or signal enhancement, involved repeated source impacts at the same point into the same set of geophones. For each source point the stacked data were recorded into the same seismic data file, or record, and theoretically the seismic signal arrived at the same time from each refracting layer and thus was enhanced while noise was random and tended to be reduced or canceled. Overall, the quality of the seismic data was good and identifiable first breaks (first arrival of seismic energy) were present. The seismic data were processed and interpreted with Green Mountain Geophysics' Millennium software utilizing the delay-time method of analysis.
The general geology within the survey area consists of 0 to 60 or 70 feet of soil (sandy clay or clayey sand), a caliche layer approximately 10 to 15 feet thick, underlying dry sands or clayey sands, and a silty clay red bed formation. Within the majority of the survey area the top layer of soil has been excavated to or almost to the caliche layer. Idealized geologic cross-sections of the survey area show the caliche layer as a continuous unit, however from nearby boreholes it has been determined that the presence and thickness of the caliche is variable. Figure 1 indicates the depth model results from the refraction seismic data. Note that the thickness of the caliche layer is estimated at approximately 12 feet since it was not possible to determine its actual thickness with the refraction seismic method because of a velocity inversion. The calculated elevation at the top of the caliche correlates well with lithologic logs from nearby boreholes and dips slightly to the east.
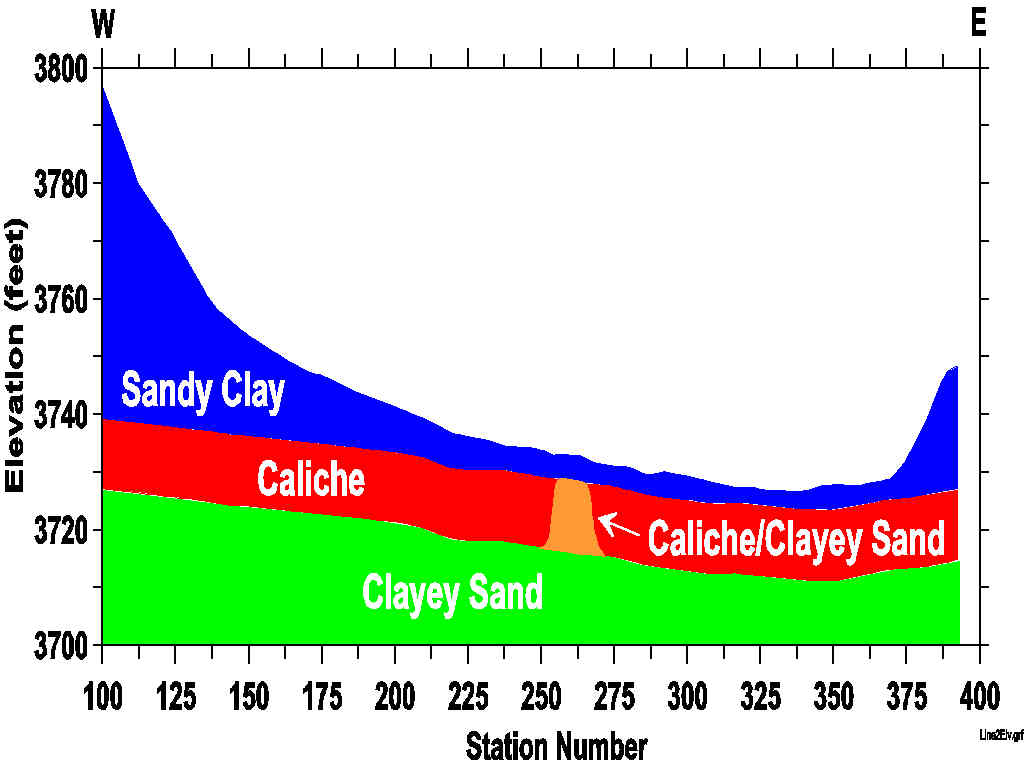
Figure 1: Refraction Seismic Depth Model with Estimated Caliche Thickness
Figure 2 shows the calculated refraction seismic velocities at the top of the caliche or interpreted caliche/clayey sand layer. In areas with velocities of 7000 feet per second or greater the caliche will be marginally to non-rippable with a D8, marginally rippable with a D9 and rippable for velocities less than 7250 or 7500 feet per second for the D10 and D11, respectively. Where the caliche velocities range from 4000 to 7000 feet per second it should be possible to rip the caliche with the D8 through D11 (except for marginal rippability above 5500 feet per second for the D8 and 6300 feet per second for the D9). Where the velocities are less than about 4000 feet per second the caliche layer is interpreted as a combination of caliche and clayey sand. The average velocities of the soil horizon above the caliche are generally less than 2000 feet per second and will be easily ripped or excavated by tractors less than size D8 (note that the current Caterpillar charts include only tractors D8 through D11).
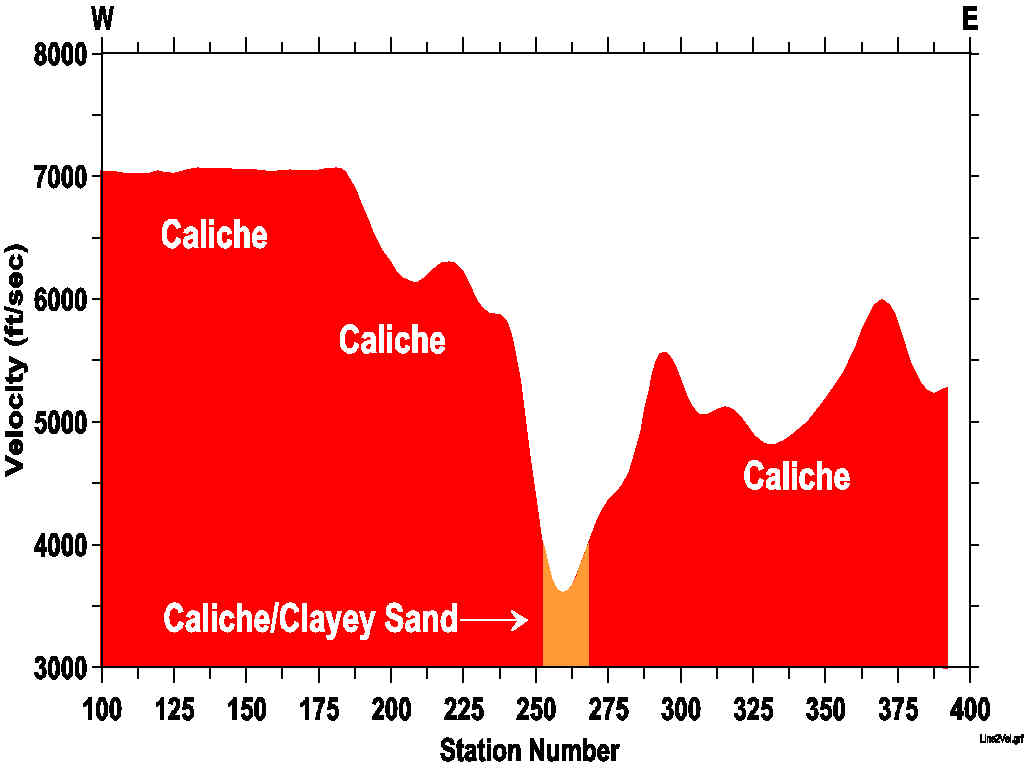
Figure 2: Refraction Seismic Velocity Model
Rippability surveys are routinely run using charts developed by Caterpillar Inc. However, according to Caterpillar, ripping is still more art than science, and much will depend upon operator skill and experience. Caterpillar states in their Performance Handbook that tooth penetration is often the key to ripping success, regardless of seismic velocity. This is particularly true in homogeneous materials such as fine-grained caliches. It is also true in formations such as conglomerates or caliches containing rock fragments. Low seismic velocities in sedimentary rocks can indicate probable rippability. However, if the fractures and bedding joints do not allow tooth penetration then the material may not be ripped effectively. Pre-blasting or "popping" may induce sufficient fracturing to permit tooth entry, particularly in caliches, conglomerates and some other rocks.
![]()
Hasbrouck Geophysics, Inc.
12 Woodside Drive
Prescott, Arizona 86305
USA
928-778-6320 (Telephone and Fax)
928-925-4424 (Mobile)
jim@hasgeo.com (E-mail)
![]()
![]()
Last Modified: 10 November 2004 @ 15:40