Groundwater, Engineering, Environmental & Mining
![]() Hasbrouck
Geophysics, Inc.
Hasbrouck
Geophysics, Inc.
![]()
Groundwater, Engineering, Environmental &
Mining
Groundwater Supply (Refraction Seismic and Electrical Resistivity)
Refraction seismic and electrical resistivity data were acquired for a project in the southwest United States to aid in the search for "clean" water supplies. The purposes of the geophysical surveys were to determine depth to bedrock, outline channels so as to locate possible recharge areas, and give an indication of relative water quality differences from four survey areas. Only one survey area will be shown in this example, however the geology was similar in all four and consisted of a dry sand and gravel layer overlying a water-saturated clay, sand and gravel layer, and a clay bedrock.
48-channel refraction seismic data were acquired with a signal-enhancement seismograph, geophones at 20 feet intervals, and an accelerated weight-drop source with impacts at various distances offset and along the seismic profile. The coordinate locations and elevations of each geophone and source point were surveyed by use of a Global Positioning System (GPS). The refraction seismic data were interpreted using the delay-time method.
Electrical resistivity profile data were acquired using the dipole-dipole electrode configuration, with dipole lengths of 200 feet and a maximum "n" value of 6. Electrical resistivity sounding data were acquired using the standard Schlumberger electrode configuration with AB/2 lengths varying logarithmically from 1 foot to 500 (or greater) feet. Both the dipole-dipole profile and Schlumberger sounding resistivity data were modeled using commercially available computer programs.
Figure 1 shows the locations of the five survey lines (including station numbers), three existing wells, and the Schlumberger sounding. Well #1 produces relatively "clean" water, well #2 has been abandoned due to extremely poor water quality, and well #3 contains high values of manganese and iron thus resulting in marginal water quality. Line 1 is located to pass reasonably close to the existing wells #2 and #3, with the criteria that the line be at least one-half dipole length (100 feet) away from exiting powerlines, pipelines, and surface metallic structures to minimize adverse effects to the resistivity data.
Figure 1: Station Location Map
Figure 2 is the refraction seismic and electrical resistivity profile data interpretation model for line 4, which is representative of all the lines within the survey. The assignment of geology versus velocity for the refraction seismic interpretation is a result of average worldwide geology/velocity relationships and inspection of available lithologic logs. Figure 3 is the interpreted Schlumberger sounding and indicates good correlation with the interpretation results shown in figure 2. The sounding is located as close as possible to well #1 (considering the presence of several nearby cultural geophysical noise sources). Figure 4 is a contour map showing the elevation of the clay, or bedrock, layer (surface elevation change over the entire survey area is less than 5 feet). Note that both the refraction seismic and electrical resistivity surveys were conducted along the same lines and although the seismic method was not adversely affected by the presence of powerlines, the resistivity method was affected therefore the survey lines were limited in their northern and western extents.
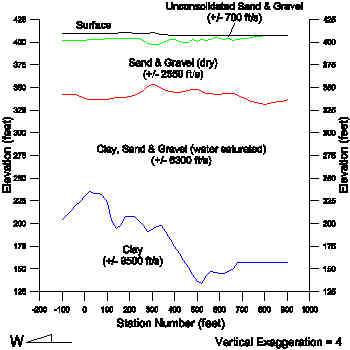 Figure 2: Seismic/Resistivity Elevation Model |
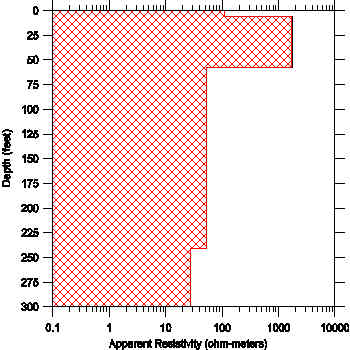 Figure 3: Interpreted Schlumberger Sounding |
Figure 4: Clay Layer Elevation (Note: Surface elevation change over
entire survey area less than 5 feet.)
As shown in figure 4, a predominant decrease in elevation of the clay layer is evident along the approximate eastern half of line 4 and extends from almost line 2 to 3 (if the 190 feet elevation contour is considered the limit). The elevation of the clay layer increases south of line 2, north of line 3 and west of line 5 with what could be considered as ridges approximately along line 1 and south of line 2. Beyond the western extents of lines 2 and 4 there may be the beginnings of another trough and perhaps another one at the southeastern edge of the map although this trough may be influenced by the contouring algorithm (minimum curvature).
The decreased clay layer elevation was interpreted as a bedrock channel, or depression, suitable for groundwater recharge. A substantial decrease in thickness of the sand and gravel layer (i.e., increased clay layer elevation) near well #2 suggests why extremely poor water quality was found at that location and well #3 appears to be near the edge of the thicker sand and gravel or recharge area which may explain its marginal water quality. Because of geophysical considerations (primarily powerlines) it was necessary to locate the center of the resistivity sounding approximately 650 feet away from existing "good" well #1. The resistivity value of the water-saturated zone from the sounding was lower (i.e., higher conductivity) than in areas with similar geology that produce relatively "clean" water and may be more representative of the marginal water quality found in well #3 versus well #1's "clean" water.
So as to encounter an area with increased sand and gravel thickness (i.e., decreased clay layer elevation) and thus greater groundwater recharge, it has been recommended that a well be drilled in the vicinity of line 4 and east of line 5. When those results become available, they will be incorporated into this example.
![]()
Hasbrouck Geophysics, Inc.
12 Woodside Drive
Prescott, Arizona 86305
USA
928-778-6320 (Telephone and Fax)
928-925-4424 (Mobile)
jim@hasgeo.com (E-mail)
![]()
![]()
Last Modified: 10 November 2004 @ 15:40